
Note: you will not necessarily get this performance, figures include gearing (at times), and cash positions (at times). I don’t post all trades, although most positions are posted, I don’t necessarily write up at the time I get in.
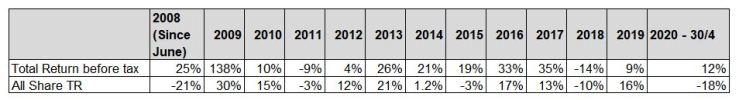
Performance Chart

I can give only somewhat rough performance figures. These need to be understood in context. In part I structure my investing around my life – if I need money on occasion I have had to sell holdings. Sometimes due to other ventures I have liquidated positions / been too busy to find other things to invest in. Also my record keeping was somewhat sketchy in the early days so figures should be regarded as approximate – but they are more or less accurate…
During my time in China (2002-Dec 2004) I lost a little money – this was really experimental trading and learning what worked and what didn’t.
I don’t have records prior to May 2008. This is when I left my job in the city – with the aim of doing something else and putting more time into my investing. Prior to this I was restricted due to the nature of a number of my jobs – so I have no clue as to performance on the handful of trades I made. I am pretty sure I made money from 05-08, but it wasn’t much.
From May- December 2008 I was busy with a new job at Teesside University. Performance was still strong – up 24% – almost all in December 08.
2009 – my best year to date. I caught the natural resources rally – making money on KAZ, IFL, GFM amongst others – I was also very bullish and levered appropriately – performance up 137%.
2010 – I was busy trying to set up a business. Held quite a bit of cash. -8%. Lucky escape on ROK.
2011 – Not terribly successful- I started a new job which was a bit of a disaster, also held a lot of cash. -9%. Losses on EZJ, TRB, DCI, RWD, if only I had held!
2012 – A better year – I was still distracted by yet another switch of job and my buying another property, much cash still held +4%, Hurt by KPN’s poor performance, Silver.
2013 – A return to form – stability in my life leads to better results. +21% returns from FFY, Fondul Proprietatea, Lamprell, EDF, TCF, losses on Silver
2014 – +21% – good returns from Man Group, FFY, Fondul Proprietatea, Lamprell, TCF, NG. disappointments from ACHL, IERP, POL, Silver, EDF, KPN.
2015 – +18.6%. FFY has done well, EMG, TJI, WIND, TNCI
2016 – + 33% Brexit / Trump election both helped and blew me around a bit. Good investments in TRB, TJI, ALF, Lost on SGI, Emergent Capital, Appliances Online. Performance includes 100% writeoff of RHM – which is delisted but still trading.
2017 – + 35% Crypto currency helped as did TJI (assuming it pays out)/ Good performance on ALF, KMG,
2018 – -14% early 2018 hit by crypto bubble crash. Later in 2018 focus was on changing job.
2019 – Changed job. Bought a car park both were a distraction. Back-end of the year was helped by my discovery of the Russian stock market. Heavy cash positions.
It should be noted when looking at these performance figures I use leverage at times, but equally I sometimes hold a lot of cash (50% of portfolio +). All figures given are actual returns ex leverage – ie. If I have £100 equity and I lever up 20% my £120 investment grows at 10% = to 132 I will show this as a return of 12%. Figures are total return and include the effect of all financing charges, and commissions. They exclude tax (other than stamp duty and 10% dividend withholding tax).

maybe you could list your portfolio….
I could but the problem is sometimes I want to buy / sell without people knowing – due to liquidity, so I only list it periodically.
[…] Performance […]